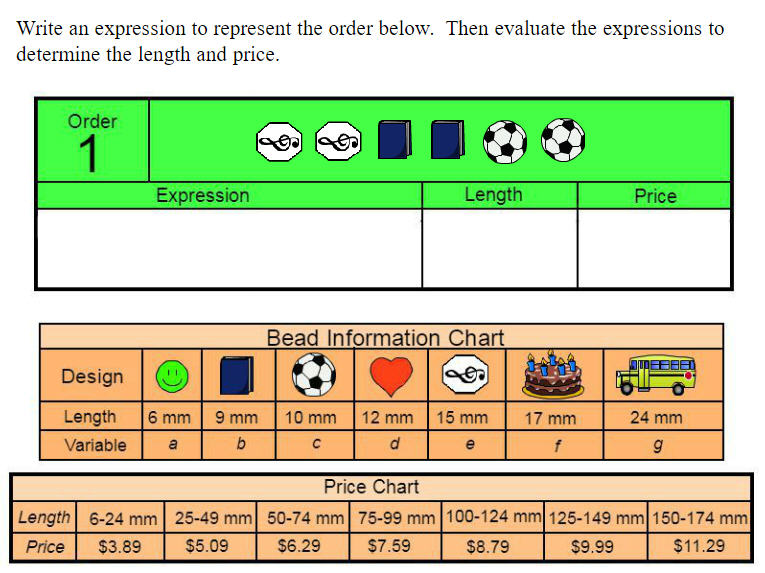
Representing and interpreting data is a common theme in elementary mathematics instruction. Unfortunately, most activities seem to "spoon feed" the representation, typically a bar or line graph, to students with the x- and y-axis, labels, and scale all completed and ready to go.
What happened to the good old days when students were handed a piece of graph paper and had to create the representation from scratch? I can appreciate the need for students to efficiently demonstrate their knowledge, but I feel strongly that students need to create graphs 'from scratch' like we used to (as recorded in black and white movies!) when we were children.
Read More